Portfolio Management

Portfolio management is the art and the science of investing in worthwhile opportunities to maximize returns and minimize risks simultaneously. It requires developing a sustainable, adaptable worldview and understanding of human nature and its activities on both micro and macro scales.
This article starts by exploring behavioral finance to learn how an investor values their investment options. It then delves into macroeconomics, especially monetary policy and its centrality to all financial opportunities in the world. Finally, we look at financial mathematics, which handles the problems of opportunity assessment and the optimal execution of trades.

Behavioral Finance: Investor Behavior
St. Petersburg Paradox
In 1713, the renowned mathematician Daniel Bernoulli studied gambling. The game is simple: a coin is flipped; if it lands on heads, the coin continues to be flipped until it lands on tails. The player walks away with 2n ducats, where n is the number of consecutive heads preceding the tails-end coin flip. Mathematically, a rational person should be willing to pay infinity for such a game since an infinite return is the expected payoff.
Bernoulli exposed this apparent contradiction between the expected payoff of such a lottery (what people should be willing to pay) and how much people are willing to pay for lottery tickets in the St. Petersburg paradox. He concluded that people don’t value money linearly, i.e., the more money, the better. Instead, people unconsciously use a utility function to map the amount of money to their happiness from making this amount. This paradox leads to the concept of financial utility.

Financial Utility
Financial utility is a measurement invented by economists to capture how money contributes to a person’s happiness and welfare. The amount of money that contributes to a certain level of happiness considers the current amount of existing money.
The concept of financial utility also introduces the notion of a person’s risk aversion coefficient, that is, the extent to which a person tends to avoid risk. People like to make money, but any investment opportunity comes with risks. So, given two opportunities with the same expected reward, a rational person would choose the one with fewer risks. Genetics and environmental factors such as upbringing and life experiences make some people risk-seeking while others are more risk-averse.
In behavioral economics, prospect theory asserts that people generally don’t value losing and winning equally; psychologically, people are hurt more by losing the same amount than by gaining the same amount — another indication of the tendency towards risk aversion in human behavior, and an affirmation of the relevance of financial utility in judging value.
The interplay between risk and reward shapes a person's assessment of the financial utility of choice and presents them with myriad investment opportunities.
Optimal Allocation
Every investor holds a portfolio with different asset classes. These assets include stocks, bonds, foreign currencies, cryptocurrencies, real estate, financial derivatives like options and futures, and commodities like gold, silver, and oil.
The problem that a portfolio manager has to solve is the allocation of different assets to maximize the portfolio's returns while simultaneously minimizing the risk. In other words, they have to optimize for the investor’s financial utility. As the expected returns of these various asset classes change, the manager has to rebalance the portfolio against the assets’ respective risks. The cycle continues.
As the logic of opportunity cost dictates, if an investment is lucrative enough and diffuses the risk in the whole portfolio, the manager should add it to the portfolio by replacing another asset. This implies the importance of understanding the value and risks of foreign markets and the necessity of knowledge about highly impactful global economic factors like interest rates, inflation rates, and currency risks.
Macroeconomics

The biggest market player in each country is the central bank, which ensures inflation is kept within the target range and that the population is fully employed. These circumstances ensure that the economy is reaching its full potential. The central bank’s primary tool to manipulate the economy is interest rates, which it adjusts based on available data on inflation, the job market, and consumer sentiment.
Inflation can rise due to a variety of reasons. Sometimes, demand for goods and services increases to trigger demand-pull inflation. This is what we observed after COVID-19 regulations were dismantled. Other times, it’s because of cost-push inflation, when the supply of a specific commodity decreases, for example, during the Arab Oil Embargo in 1973 and the Iranian Islamic revolution in 1979 when oil became more expensive.
If the inflation rate is high, central banks try to cool off the market by increasing the interest rates, thus making it more expensive to borrow money, buy houses and cars, and open new businesses. If the inflation rate is low or even negative, like in the curious case of Japan, central banks often cut the rates into negative territories to encourage individuals to spend and businesses to invest.
Interest Rates, Currency Pairs, and Bets Against Central Banks
Interest rates affect everything from house prices, tracked using the Case-Shiller index (which takes monthly recordings of the prices of single-family homes in the U.S. as a measurement of the average price of such homes in different economic environments), to commodities like gold, and securities like stocks and bonds. When interest rates are high, investors flock to high-yielding, low-risk securities like treasury bills and bonds; this confirms the psychological findings of behavioral finance since it demonstrates that people prefer lowering risk.
Interest rates also affect the access of different economies to capital. If the US Treasury offers T-bills with a yield of 5% while equivalent German security is at 3.45% at a given moment, ignoring currency risk, European investors could invest in American T-bills and earn more in dollars across the pond for a higher payoff.
The newly created demand for dollars would tilt the currency swap in its favor. This makes European goods more attractive to Americans while leaving American exports less attractive to the Eurozone. The FED, America’s central bank, can choose to intervene or not. If it decides to intervene, the FED can print more dollars to cheapen the currency, risking higher inflation. It could also sell its euro reserves to offset the demand for the dollar by the supply it provides.
Investors can bet on the FED’s policies based on inflation numbers or job reports. An investor, for instance, can consider how the policies will affect the EUR-USD currency pair and buy or sell such a pair to make a profit. A more realistic example is how hedge funds bet against the Bank of Japan and shorted the Japanese yen earlier this year.
The return of treasury bills across the world to help finance the government’s policies. The above table lists the percentage yields (incomes) of different kinds of short-term government loans with the same start of loan date and expected day of payment (maturity) date.
Financial Mathematics: Pricing, Rebalancing, and Trade Execution
The two problems portfolio managers have to solve are asset allocation and proper execution of the trades. They seek asset diversification as a de-risking mechanism. When considering different markets, they compare various securities using a few parameters like risk, return, and opportunity cost.
The wealth wizards of Wall Street, often called quants, use financial mathematics to produce securities statistics when they ‘model the market.’ Quants also use financial mathematics to price exotic options and estimate the value at risk for a collection of portfolios. Their mathematician’s toolbox includes probability theory, Ito’s calculus, optimal control, game theory, and Montecarlo simulations. Brief explanations of these tools are in the Appendix.

Asset Allocation and Optimal Execution
At every interval, a portfolio's securities need to be revised for future profitability. Quants have to predict future returns and risks for different securities. Many methods exist to rebalance the portfolio to maximize an investor’s financial utility. Some groundbreaking work is Modern Portfolio Theory and Merton’s Portfolio Problem, explained in more detail in the appendix.
After assessing which securities to buy and sell, the execution of the trades is an interesting problem in itself. A simple investor buying a few stocks won't feel the market impact of their trade (i.e., the effect that the price moves against participants, with buying pushing prices higher and selling pushing prices lower) because their trading volume is fairly small compared to the number of stocks being sold or purchased at any point in time.
Institutional investors, on the other hand, with tens or hundreds of billions of dollars under management, must execute their trades very carefully according to mathematical models to minimize this disadvantageous impact. Practitioners have relied on the most seminal work on large-scale execution of trades to guide their actions: Optimal Execution of Portfolio Execution, a research paper that relies on modeling the order book.
Pricing Financial Derivatives
A stock option is an option to buy or sell a company's stock at a set price. A buy option is called a call option. A sell option is called a put option. Options amount to a bet on whether a stock increases in price if it’s a call option or decreases if it’s a put option. On the other hand, futures contracts — agreements to buy or sell assets at a set future time — act as hedges against future uncertainty when buying a particular commodity like oil.
Options, futures, and swaptions are called financial derivatives. If the underlying asset is a stock, these derivatives are first-order bets. If the underlying asset is a derivative, then the corresponding security becomes a high-order bet. These bets are codified in contracts so that the sale and purchase of assets and derivatives are standard operations in a stock exchange.
Value at Risk
Unfortunately, the prevalence of derivatives, which usually take the form of high-order bets, makes for a complex financial system where it’s hard to pin down risk before a financial meltdown happens. After the 2007 recession, regulators introduced tighter bank management. In Europe, regulators introduced Basel Accord’s regulatory capital requirements, which mandate that banks operating in Europe must calculate the value at risk on their books daily to keep financial risk in check.
Appendix: Finance
Although one could keep securities and hold them until finally liquidating the portfolio, most portfolio managers take a more active approach and individually rebalance portfolios, i.e., sell and buy securities based on the risks of selling and buying each stock and seek a return on every security upon assessment of each security’s value.
Modern Portfolio Theorem (MPT)
The modern portfolio theorem is a framework to obtain the weights of different stocks and bonds in a diversified portfolio to maximize the expected return and minimize risk or volatility based on historical data. The theorem is also called mean-variance optimization since variance is used as a proxy for uncertainty.
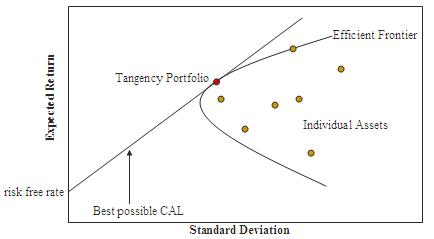
The top half of the curve above is called the efficient frontier and demarcates where people should try to invest based on their tolerance to risk. The apex contains data for the global minimum variance portfolio, where risk remains minimal while still investing in equities.
The model is not used in its pure form because of its numerical instability, exclusion of transaction fees, etc. However, it has served as the baseline for any portfolio rebalancing strategy. It also has provided financial economists with great guidance on other foundational trading principles, like the risk-return spectrum, the efficient frontier, and the market portfolio.
In 1990, finance professor Harry Markowitz won the Nobel Prize in economics due to his contributions to financial economics in the area of modern portfolio theory.
Merton’s Portfolio Problem
Economist Robert Merton extended Markowitz's ideas even further using the concepts of optimal control mentioned below. Merton’s model considers maximizing the investor’s perception of expected utility rather than maximizing the returns minus uncertainty model to understand investor behavior.
The expected utility function has risk aversion baked in, so we don’t need to factor in the impact of investor uncertainty separately. The model also considers a long-term strategy for rebalancing a portfolio, not just for one time, like in modern portfolio theory.
Merton’s model also considers the cost of consumption a reasonable move since a person can’t save all their money without enjoying life. The model is, therefore, still applicable despite changing consumption levels (since different people have different spending patterns).
Merton won the Nobel Prize in 2003 for his seminal work alongside Myron Scholes.
However, the model isn't without its critics, especially Nobel laureate Bob Shiller, a Yale academic who predicted the financial crash in 2007. Shiller focused on behavioral finance throughout his career. Shiller has famously emphasized the impulsiveness of investors as well as the emergence and impact of instruments used to coerce risky and even disadvantageous investor behaviors, none of which can be captured in purely mathematical models.
In an interview with the Royal Society of Arts, he described how he found financial mathematics divorced from reality: “I go to seminars, and a guy will write this math on the board about consumers maximizing the current discounted value of utility of consumption over their lifetime. I hate to say it; it never sounded right to me. I actually wrote papers like that; I had to get tenure.”
Appendix: Math
Probability Theory
In real life, events happen sporadically and inconsistently. Sometimes, there’s no way to tell for sure when an event is going to happen. Probability theory attempts to address uncertainty with a confidence interval that defines the scope of a highly likely event.
A random variable is a variable that takes the form of some random values. The sample space of a random variable is the set that defines all its possible outcomes. Probability distributions describe the likelihood of a random variable to be an exact value from the sample space. Probability distributions can be summarized using their plots and somewhat less verbosely using their moments. These moments signify the points at which interesting events happen.
Mean (expectation), variance, and skewness of the probability distribution graphical plots are some special moments. The expectation is the first moment. It’s also the value where most of the events happen throughout the run-time of the experiment. The variance is the second central moment. It informs us about how far away most events are expected to be around the expected value.
Ito’s Calculus
Stock prices change abruptly. This makes a function representing a stock price nowhere differentiable, although everywhere continuous. Ito’s calculus provides a way to differentiate such unsmooth functions to find the rate at which they change and when they reach minima or maxima.
The Black-Scholes partial differential equation, the most significant equation in finance, was derived using Ito’s calculus. It gave mathematical legitimacy for pricing securities like options, futures, and swaptions for the first time in history. The trading of such derivatives boomed as a result. Myron Scholes and Robert Merton received the 1997 Nobel Prize in economics (Fischer Black died earlier).
Optimal Control
Optimal control is a branch of mathematics that optimizes dynamical systems. NASA uses it to optimize the fuel requirements of the space shuttles going to the moon. In finance, it’s used to optimize long-term trading strategies to maximize the return. It relies on the Hamilton-Jacobi-Bellman equation, a continuous-time equivalent of the Bellman equation widely used in reinforcement learning in its discrete form.
Although critics argue that long-term optimization doesn’t make much sense for the average person (see Shiller’s critique of Merton’s problem in “Appendix: Finance” above), theorists use the HJB equation to derive intuitions regarding how investors think and act.
Game Theory
Game theory is the science used to model cooperation and conflict through quantifying incentives. It’s used in political science, behavioral economics, and, of course, evolutionary biology.
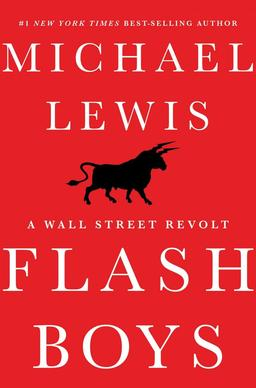
Predatory trading is trading that exploits market participants to adjust their position in the market. In his book Flash Boys, Michael Lewis explores one of its examples, front-running. Front-running happens when some market participants learn about the orders coming into the market, execute them first, and re-sell them to the party initiating the order, pocketing a profit. Game theoretical models are used to handle orders that include other market participants.
Montecarlo Simulations
Financial options come in a very diverse range of types. An option could rarely be modeled using a closed-form solution (an equation that gives a result from a closed, accepted set). Ito’s calculus can only handle some of these options before it fails. When it does, we simulate millions of random events and arrive at the average price of these different simulated prices.
Throughout an experiment, we collect enough data to describe an empirical distribution. We then try to match this empirical distribution to one of the well-studied distributions. The law of large numbers (LLN) states that the more data points we collect, the closer the empirical distribution converges to that real distribution.

